
In this article, I will use patents to take a macro-level look at the state of technological development worldwide.
Last year, the World Intellectual Property Organization (WIPO) published World Intellectual Property Indicators 2025. It is a substantial report containing worldwide patent data for 2024. I have selected and summarized the findings that struck me most.
📈 Total applications
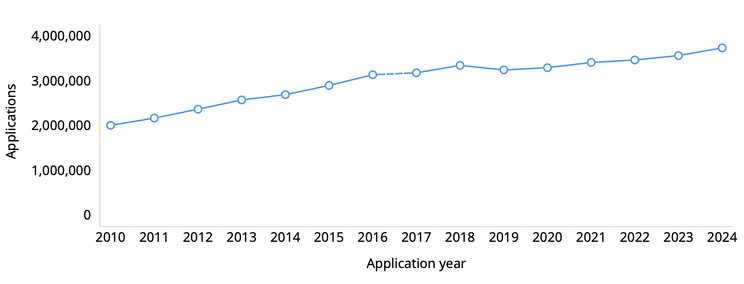
Worldwide patent applications reached 3.7 million in 2024, up 4.9% from the previous year: the fastest growth since 2018 and the fifth consecutive annual increase. Over the longer term, the total has nearly doubled in the 14 years since 2010, when it was around 2 million.
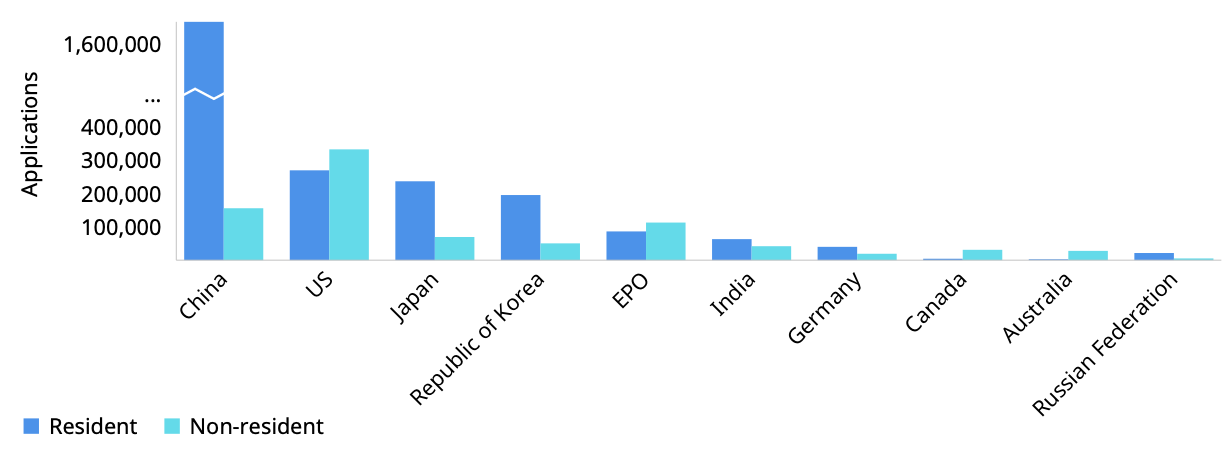
The difference between resident and non-resident filing trends is interesting. Of the 3.7 million applications in 2024, 2.7 million (72.6%) were resident filings, made by applicants in their own country. They increased much faster than non-resident filings, by 6.8%, the highest rate since 2016. This suggests that innovation is increasingly oriented toward securing rights at home first.
However, this also reflects China’s overwhelming application volume, which has risen dramatically in recent years:
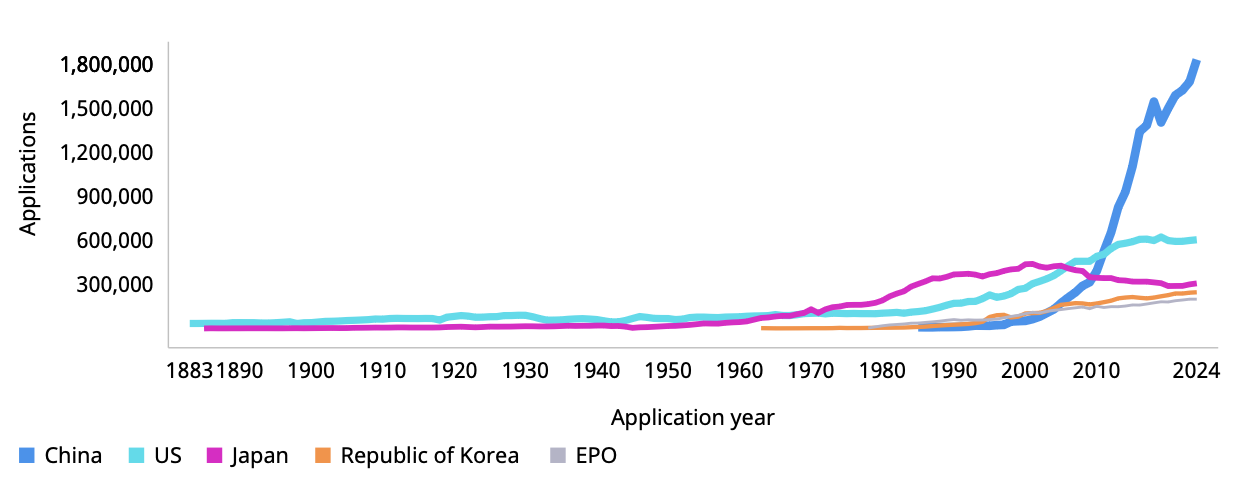
I will discuss China’s effect on global filing trends below.
🌏 Applications by country
From 1883 through the 1960s, the United States consistently had the world’s leading patent office. Japan overtook it in 1968, followed by China in 2011. China now holds an overwhelming lead.
By continent, Asian patent offices account for 70.1% of worldwide filings, roughly 10 percentage points above the 60% of a decade earlier. North America’s share, by contrast, fell from 22.9% to 17.1%, and Europe’s from 12.9% to 9.7%. Global patent activity is rapidly concentrating in a small number of Asian hubs.
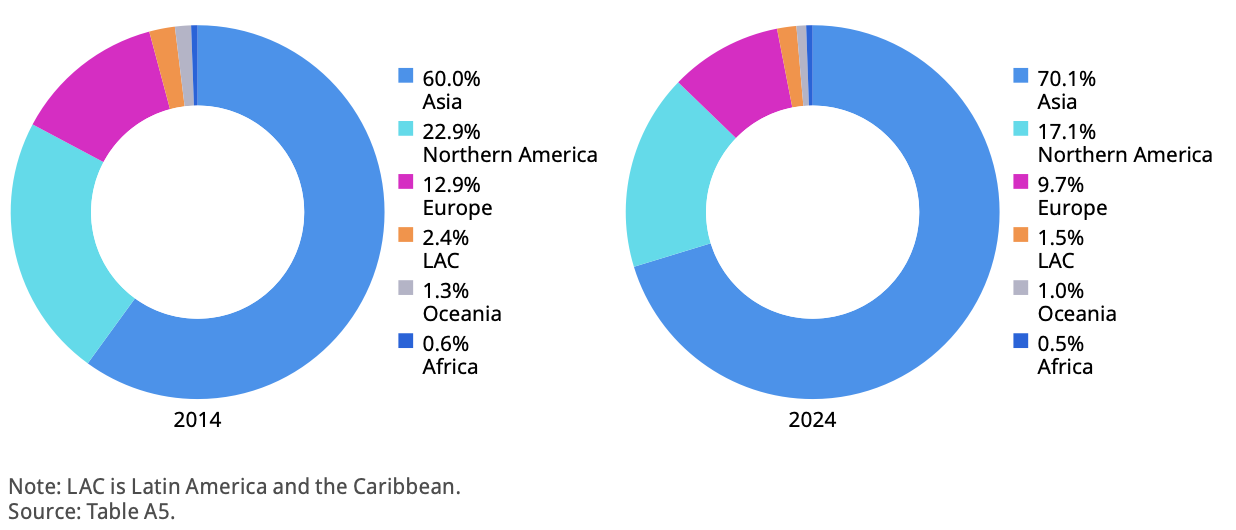
Meanwhile, the five leading patent offices — China, the United States, Japan, South Korea, and Europe — still account for an overwhelming majority, 85.5% of the worldwide total.
🗺️ National filing patterns
The same word, “filing,” can describe very different patterns in different countries. Let us begin with China, as promised.
China: Its 1.8 million applications in 2024, or 49.1% of the global total, place it far ahead. Yet its foreign filing share is unusually low at 6.9%, making the system thoroughly domestic in orientation. In fact, 96.7% of China-origin patents are single-office filings, submitted in just one jurisdiction.
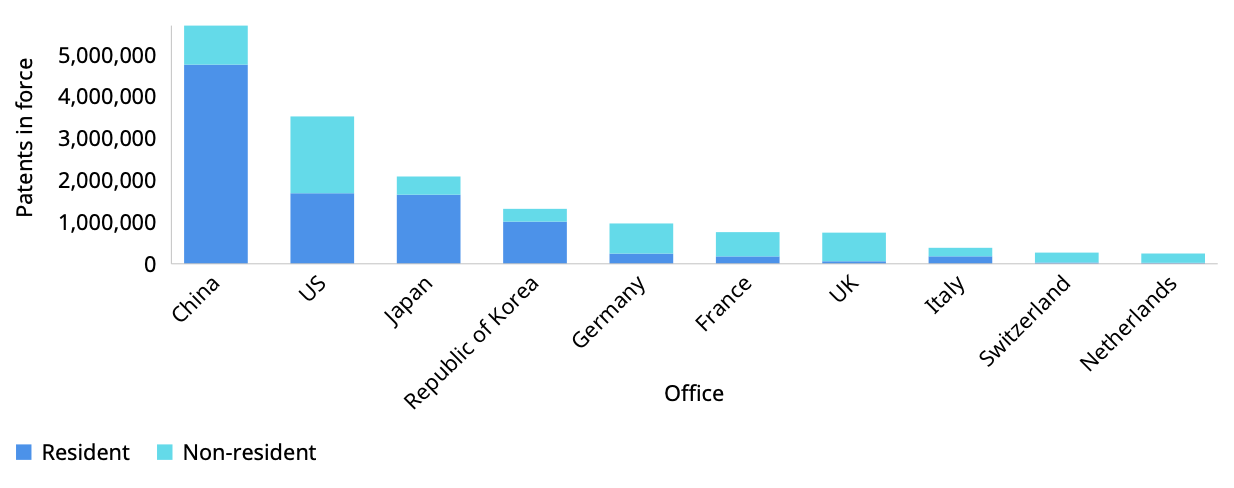
United States: Although second in total applications, it remains first worldwide for applications filed abroad, at around 230,000. It maintains influence through international coverage.
This is the most striking part of the indicators. China accounts for approximately 70% of worldwide patent families — distinct inventions after duplicates are removed — yet ranks only third for foreign-oriented families filed in multiple countries. The United States is clearly first in that category.
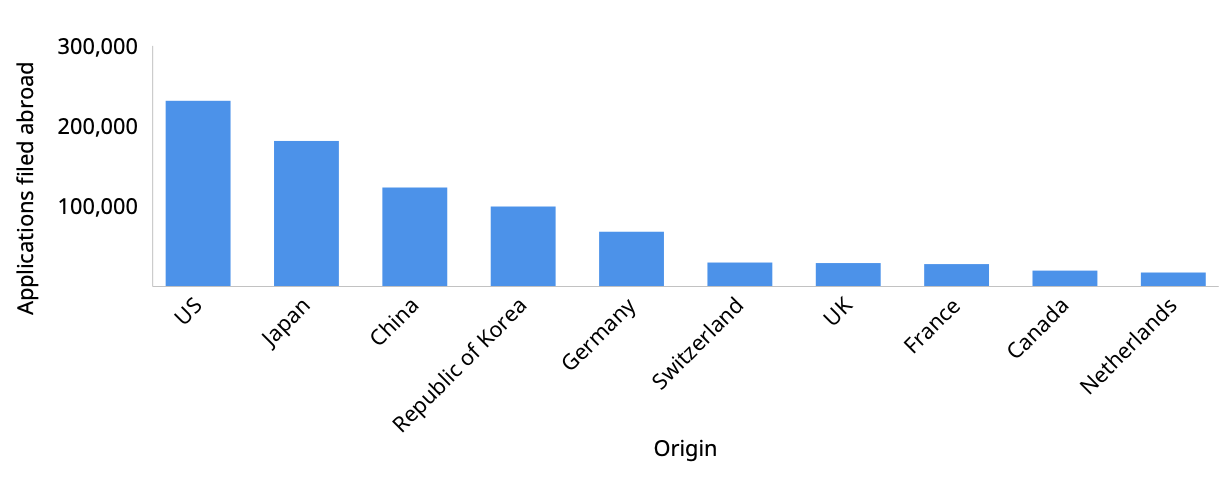
In other words, China builds influence through large-scale, domestically focused rights protection, while the United States does so through broad geographic coverage. Their choices clearly diverge: China emphasizes volume, the United States coverage.
Other notable countries include:
India: Growth of 19.1%, marking an impressive sixth consecutive year of double-digit growth, points to an emerging patent powerhouse. Türkiye and Finland are also continuing to post double-digit increases.
Netherlands, Sweden, and Switzerland: They pursue a multi-office strategy, with more than 70% of their patents filed in at least two countries.
💻 Distribution by technology field
Alongside regions and countries, let us look at technology fields. These figures are for 2023, the latest year with complete data because of the lag between filing and publication.
When worldwide applications are divided by technology field, computer technology leads decisively at 13.2%. It is followed by electrical machinery and energy (7.2%), measurement (6.2%), digital communication (5.8%), and medical technology (4.9%).
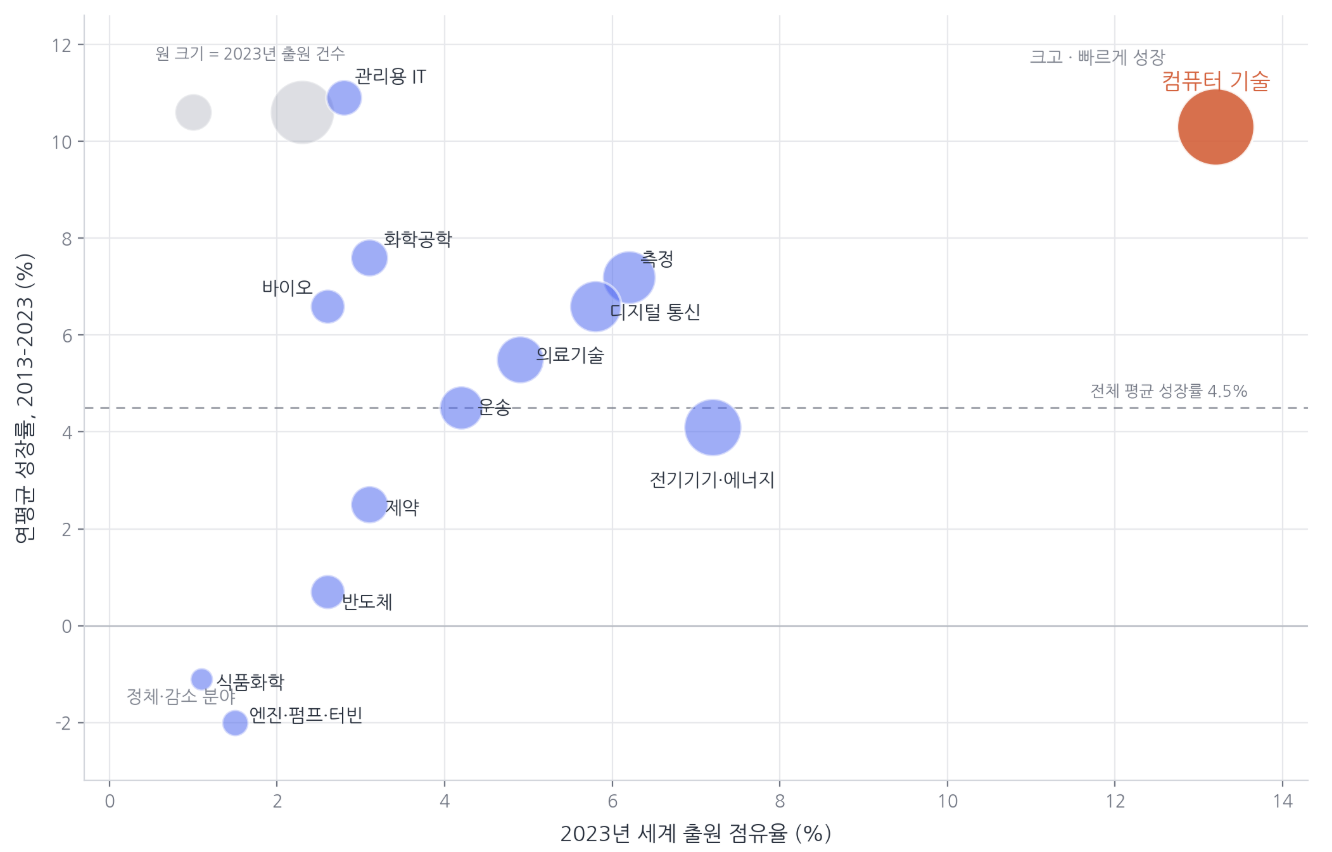
These five fields increased their combined share from 29.4% in 2013 to 37.4% in 2023, with computer technology accounting for most of that rise. Computer technology applications grew more than 2.6-fold over the decade, from around 170,000 to 450,000. Their average annual growth of 10.3% was the only double-digit rate among the top ten fields identified by WIPO.
A broad picture of national specialization in particular fields looks like this:
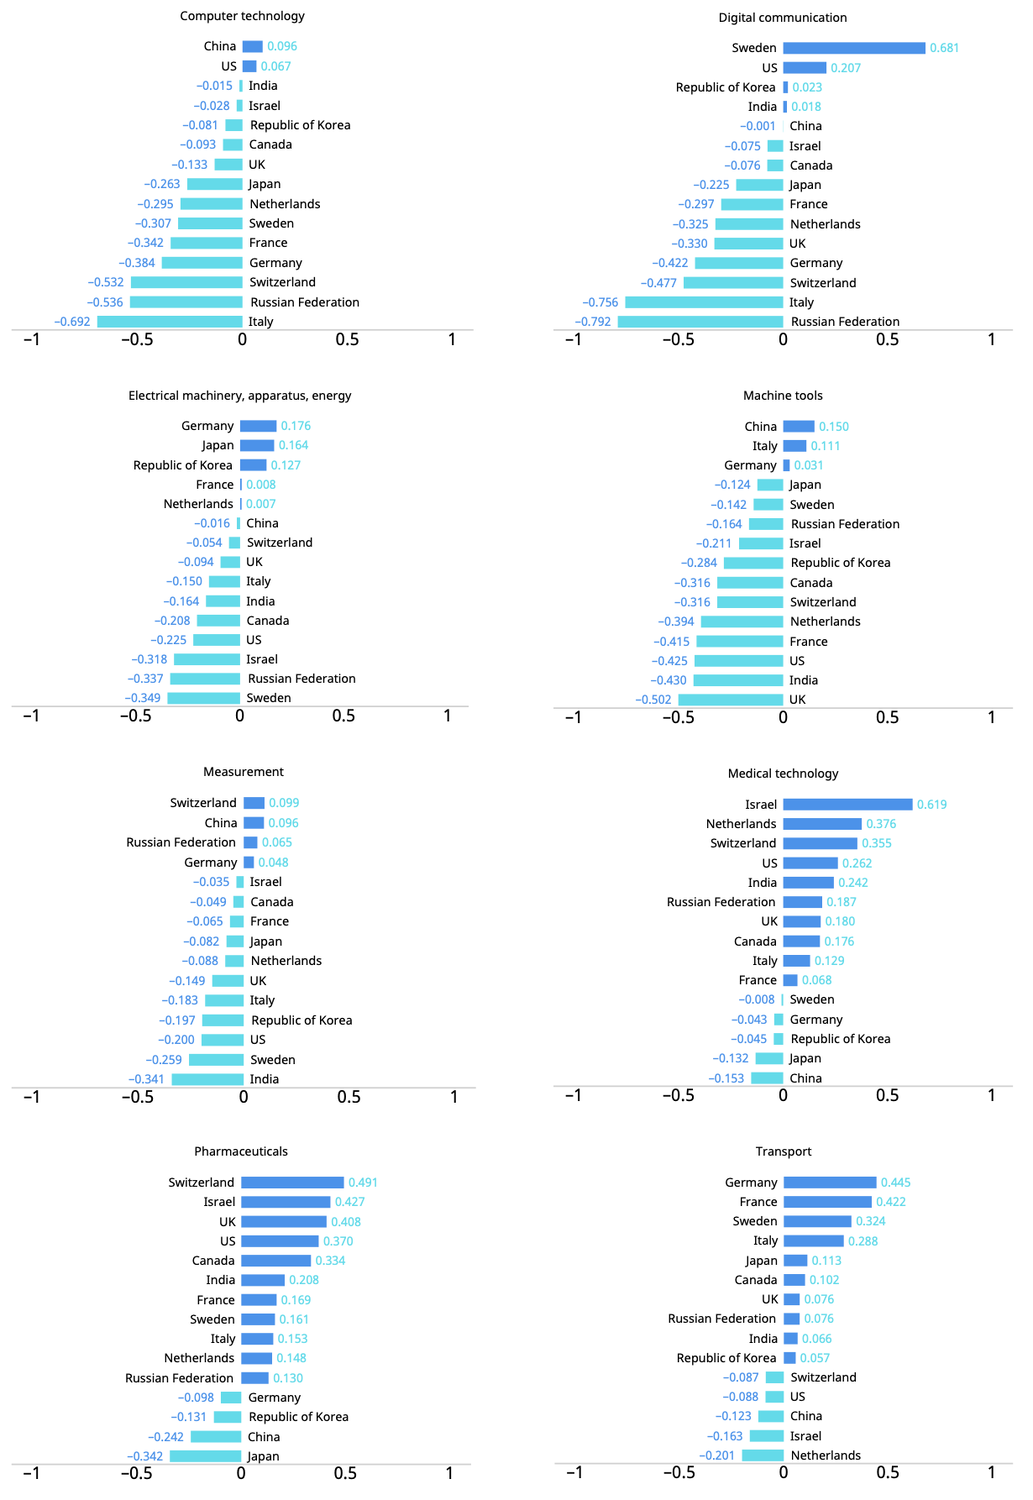
China and the United States are strong in computer technology. Sweden stands out especially in digital communication, followed by South Korea, India, and the United States. Germany, Japan, and South Korea show strength in electrical machinery and energy; Israel, Europe — including Switzerland and the United Kingdom — and the United States in medical technology and pharmaceuticals; and European countries such as France, Germany, and Italy in transport.
In brief, Europe specializes in transport, while Asia and the United States specialize in computers and digital communication. South Korea appears in both digital communication and electricity and energy.
🧭 Closing thoughts
Let me bring together my impressions after reviewing the patent indicators report.
First, the contrast between China’s volume and America’s coverage is clear. The fact that 96.7% of China-origin patents are single-office filings in just one jurisdiction illustrates its model of large-scale domestic rights protection. The United States, by contrast, continues to exert influence through rights networks spread widely across multiple countries.
The advances of emerging countries such as India and Türkiye are also notable. For technology and industry, these are new competitors; for the patent profession, they also represent newly opening markets.
My conclusion is therefore this: future analysis of national and industry patent strategies should focus less on how many applications are filed and more on which technologies are protected and across which countries the rights network extends. The indicators in this report already seem to point in that direction.
“The world through patents” will be a series. In the next few installments, I will take a deeper look at specific technologies one by one — including quantum technology, cancer treatment, and space technology.
#BetweenRulesAndTech #PatentTrends #WIPO #GlobalInnovation #IPStrategy #AsianInnovation